Displaying a list of applied filters
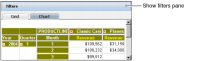
To display a list of applied filters in the filters pane, choose the double arrows, as shown in
Figure 5‑20.
Figure 5‑20 Choosing to show the filters pane
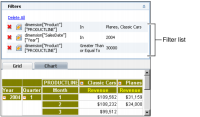
The filter list appears, as shown in
Figure 5‑21. To ensure that the filters you apply to a cross tab produce the desired results, review each to determine a logical result.
In
Figure 5‑21, the following filters appear in the list:

A filter applies to the product line dimension, displaying values using the In operator to include Classic Cars and Planes.
A filter applies to the year dimension, displaying a value using the In operator to 2004.
A filter applies to the revenue measures for each month and product line, displaying values greater than or equal to $30,000.
Figure 5‑21 Displaying the list of applied filters