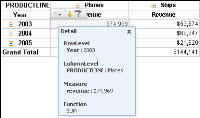
To view details of cross tab data, right-click a cell in the data area. From the menu, choose Show Detail Tooltip. A tooltip displays the column and row-level details, the measure value, and which aggregate function applies for the selected cell, as shown in
Figure 2‑5. Displaying this detailed tooltip information is especially useful when analyzing data in a large cross tab in which you cannot simultaneously view the column heading, row heading, and cell in your browser window.