Specifying multiple conditional formatting rules
You can create up to three conditional formatting rules for a cross tab element. You can, for example, create three rules to display each revenue value in one of the following formats, depending on its value, as shown in
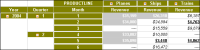
Figure 2‑19:

A value less than or equal to $5,000 appears bold and underlined.
A value between $5,001 and $24,999 appears as italic text on a white background.
A value greater than or equal to $25,000 appears as bold, white text on a gray background.
Figure 2‑19 Applying three conditional formatting rules
For each cross tab data value, Data Analyzer evaluates the rules in the order in which they appear in the list of rules. As it evaluates each rule, Data Analyzer applies the specified format attributes if the condition evaluates to true.
When creating multiple rules for a column, be careful that the conditions do not cover overlapping values. Consider the following rules for a revenue value:
The first rule sets the value to blue if the value is greater than or equal to 5000.
The second rule sets the value to green if the value is greater than or equal to 1000.
If the value is 6000, the value appears in green, not blue as you might expect, because the condition in both rules is true (6000 is greater than 5000 and 1000), and the second rule supersedes the first rule. For the rules to make sense, the second rule should set the value to green if the value is between 1000 and 4999.