Displaying measures
To customize a cross tab, you can add, remove, or reorder measures. You can add one or more measures from the available cube data, which appears in the data pane.
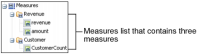
Figure 3‑13 shows a list that contains three measures: revenue, amount, and CustomerCount.
Figure 3‑13 Viewing a measures list in the data pane
A cross tab displays multiple measures in adjacent columns or rows. For example,
Figure 3‑14 displays Revenue and CustomerCount columns in each product line column.
Figure 3‑14 Displaying two measures in each product line column
In the structure pane, you can also reorder the measures by dragging one from one position and dropping it in a different position.