How to display detail and summary data
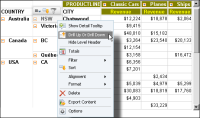
1 Right-click a column or row dimension that is in a hierarchy. From the menu, choose Drill Up Or Drill Down, as shown in
Figure 3‑45.
Figure 3‑45 Choosing Drill Up Or Drill Down for row headings
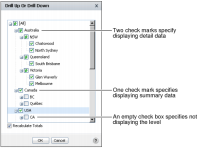
2 In Drill Up Or Drill Down, select items in the list to show detail data. For example,
Figure 3‑46 shows the levels in Australia selected to show detail data and the levels in Canada and USA deselected to show summary data. Two check marks in a check box specify displaying detail data for the level. One check mark specifies displaying summary data for the level. An empty check box specifies not displaying the level.
Figure 3‑46 Using Drill Up Or Drill Down
Choose OK.
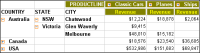
Figure 3‑47 shows a cross tab that displays detail data for states and cities in Australia and summary data for Canada and USA.
Figure 3‑47 A cross tab displaying detail and summary data