About cubes
A cube is a multidimensional data structure, optimized for analysis. A cube supports applications performing complex analyses without performing additional queries on the underlying data source. A cube organizes data into the following categories:

Measure
A measure is an aggregate, or summary, value, such as sales revenue or units of products.
Dimension
A dimension is a group, such as customers, product lines, or time periods, which aggregates measures. For example, a sales revenue cube contains data that enables viewing sales volume and revenues, both of which are measures, by customers, product lines, and time periods, all of which are dimensions.
Attribute
An attribute is a value that a cross tab developer can associate with a dimension. For example, a cross tab developer can specify that a quantity‑in‑stock value is an attribute that associates with the product line dimension.
Dimensions can contain multilevel hierarchies. For example, a region dimension can contain a hierarchy of the following dimensions: country, state, and city. A time dimension can contain a hierarchy of the following dimensions: year, quarter, month, and day. Most cubes include time dimensions, because displaying measures by day, week, month, quarter, or year, is important for data analysis. In a cube, the time dimension is a special dimension, which supports storing data in the time periods a cube developer chooses.
A developer uses Actuate BIRT Designer Professional to create a cube that contains data from one or more data sources. Then, the developer creates a cross tab that uses the cube data and specifies the cross tab appearance. The initial cross tab that appears in Data Analyzer typically displays a portion of the available cube data in a simple, easy-to-understand layout.
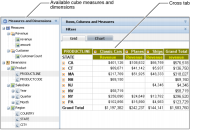
Figure 1‑3 shows a cross tab and all the cube measures and dimensions that are available for analysis.
Figure 1‑3 Data Analyzer displaying a cross tab and available measures and dimensions