Working with Data Analyzer
Working with Data Analyzer, you manipulate a cross tab to analyze its data. You can add, remove, reorganize, and customize the data and its appearance in the cross tab to examine relationships and trends. Using Data Analyzer, you can answer questions such as:

What are a product’s sales over time?
Which products sell more or less by region?
How many units of a product shipped to all locations in April?
To answer these questions, a Data Analyzer user completes the following tasks:
Drill down to display detail data, or drill up to display summary data.
Filter, group, and sort data.
Perform calculations.
Display cross tab data in a chart.
Detailed information about performing each of these tasks is available in later topics.
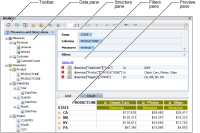
When you start Data Analyzer, your browser displays the following user interface items, as shown in
Figure 1‑4:
A toolbar contains buttons that support tasks, such as displaying cross tab totals and pivoting the cross tab.
A data pane lists the attributes, dimensions, and measures in the cube.
A structure pane lists the attributes, dimensions, and measures that appear in the cross tab columns, rows, and data area.
A filters pane displays a list of applied data filters.
A preview pane displays a cross tab or a chart.
Figure 1‑4 Using Actuate BIRT Data Analyzer
Using the toolbar, shown in
Figure 1‑4, you can complete the following tasks:
Pivot the cross tab.
Choose New Computed Measure to add calculated data values to the cross tab.
Choose Totals to specify a function to display aggregate data.
Choose Theme to change fonts and cross tab display colors.
Choose Export Content to export cross tab content to a format that is viewable in an application other than Data Analyzer.
Choose Refresh Data to update the cross tab data.
Choose Options to orient the measure header, display empty rows and columns, display a character string in empty cells, and apply a page break.
Navigate to other cross tab pages.
Undo or redo changes to the cross tab.
Access online help.
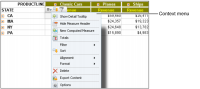
To display additional options for a specific cross tab element, right-click a cross tab element. A context menu displays commands and options next to the cross tab element. For example,
Figure 1‑5 shows the menu that appears when you right‑click a cell in the data area.
Figure 1‑5 Using a context menu for a cell in the data area
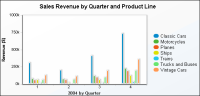
Data Analyzer also supports viewing a chart that uses the cross tab data.
Figure 1‑6 shows a column chart that displays revenue values for seven product lines for four quarters.
Figure 1‑6 Viewing a chart