About charts
A chart is a graphical representation of data. Charts are particularly useful for summarizing numeric data and showing the relationship between sets of values, called series. For example, a chart can show sales by region, average temperatures by month, or the price of a stock over three months.
Because a chart presents a picture, it reveals trends that are not as apparent in a table.
Figure 8‑1 shows an example of a table and a bar chart that display sales data. The chart shows instantly the sales trend for the year.
Figure 8‑1 Presenting sales data in a table and in a chart
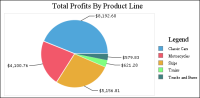
Figure 8‑2 shows an example of a pie chart that displays profits by product line. The table in
Figure 8‑3 provides the data for the pie chart. Typically, reports display detail data in a table and summary data in a chart, especially if the detail data spans multiple pages.
Figure 8‑2 Displaying profits by product line in a pie chart
Figure 8‑3 The table that provides the data for the pie chart