Inserting a chart
The location in which you insert a chart determines what data the chart displays. You can insert a chart in the following locations:

A table. A chart at the table level summarizes data for the entire table, and the chart appears at the top of every page.
A section header, if the report organizes data in sections. A chart at the section header level summarizes data for the section, and the chart appears at the top of each section. If a section’s data spans multiple pages, the chart appears on every page.
If your report design organizes data in groups instead of sections, you can create only one chart per table.
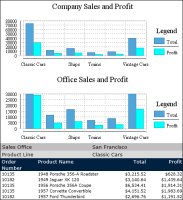
Figure 8‑4 shows one page of a 76‑page report that displays a chart at the table level and a chart at the level of the sales office section.
Figure 8‑4 Placing charts in different locations in a report design
The upper chart, inserted at the table level, displays sales and profit totals for the company. The lower chart, inserted at the sales office section level, displays sales and profit totals for the Tokyo office.