Designing reports using BIRT Studio
:
Presenting data in a chart
:
Choosing a chart type
:
About bar charts
:
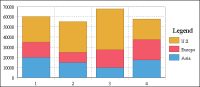
Stacked bar chart
Stacked bar chart
In a stacked bar chart, multiple series are stacked vertically, as shown in
Figure 8‑12
. The stacked bar chart shows totals for each category, each quarter in this example, as well as the proportion that each series contributes to the total.
Figure 8‑12
A stacked bar chart