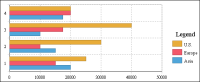
For all the bar chart subtypes, you can transpose, or flip, the axes to display data as horizontal bars.
Figure 8‑15 shows an example of a side‑by‑side bar chart with flipped axes. This feature is useful for showing data that contains many categories. For example, if you want to show sales numbers for five regions for 12 months, displaying the data requires 60 bars, which is crowded for a side‑by‑side bar chart that displays data as vertical bars.