Selecting data for a stock chart
A stock chart requires the following data:

Date values as the categories series
High values, low values, open values, and close values as the value series
Example
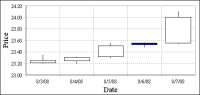
The stock chart in
Figure 8‑56 shows a stock’s high, low, open, and close values for five days.
Figure 8‑57 shows the table data that the stock chart uses.
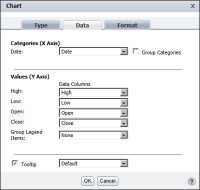
Figure 8‑58 shows how the data is selected for the chart. The Date column is the category series. The High, Low, Open, and Close columns are the value series.
Figure 8‑56 A stock chart showing high, low, open, and close values
Figure 8‑57 The table data used by the chart in
Figure 8‑56 Figure 8‑58 The data selected for the chart in
Figure 8‑56