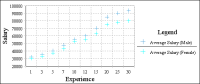
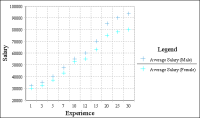
To set the height of a chart, in Chart—Format, in Chart Size, type a number in Height. When you increase or decrease a chart’s height, you increase or decrease the visual contrast between data values. Compare the charts in
Figure 8‑64 and
Figure 8‑65. Both present the same data. By changing the chart height in
Figure 8‑64, each chart presents a different impression of the data. The taller chart shows more contrast between the data values. If you look at the image alone you think there is a greater disparity between salaries earned by men and women than in the chart in
Figure 8‑64.