Working with Flash charts
Flash charts are similar to regular charts and HTML5 charts, and are designed to be used in a similar manner. The examples, as shown in
Figure 8‑79 and
Figure 8‑80, display a standard doughnut chart, and a segmented Flash doughnut chart, respectively, viewed in Actuate BIRT Viewer. In the animated Flash doughnut chart, as you select a segment, it slices away from the rest of the chart.
When you format a Flash chart, you can specify animation properties such as rotation and slicing, as you can in an HTML5 chart.
Figure 8‑79 Standard doughnut chart
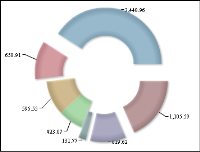
Figure 8‑80 Segmented Flash doughnut chart
In BIRT Studio you can insert a Flash chart at the table level, or at the section level, if your report organizes data in sections. You can choose from the following types of Flash charts:

Column
Bar
Line
Pie
Doughnut