Creating an HTML5 chart
The procedure you use to create an HTML5 chart is similar to the procedure used to create a BIRT chart. To create an HTML5 chart, perform the following tasks:

In BIRT Studio, select Chart
➛Insert HTML5 Chart.
In the chart builder, choose a chart type.
Select the data to use in the chart.
Format the chart.
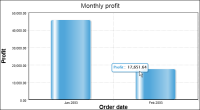
The example in
Figure 8‑92 shows an HTML5 chart displaying monthly profit values.
Figure 8‑92 HTML5 chart displaying monthly profits for each quarter
BIRT Studio supports the following HTML5 chart types:
Column
Bar
Line
Pie
Doughnut
Scatter
Area