How to select data for a cross tab
1 In BIRT Studio, choose New. Report Template appears.
2 In Report Template, complete the following steps:
1 In Category, select Standard from the drop-down list.
2 In Available Templates, select Crosstab, as shown in
Figure 7‑3.
Figure 7‑3 Choosing the cross tab template
3 In Themes, select a theme from the drop-down list if your Crosstab template contains associated themes.
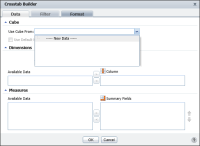
Choose OK. Crosstab Builder—Data appears.
3 In Cube, in Use Cube From, choose New Data from the drop-down list, as shown in
Figure 7‑4.
Select Data appears, displaying the available data objects. If you use customized data objects, ensure that they are in the /Resources folder of the BIRT iHub Encyclopedia volume.
Figure 7‑4 Selecting a data object data source
4 In Available Data, select a data object design or data object store file. You can select a data object design (.datadesign) file to retrieve data on demand, or a data object store (.data) file to use cached data. Select a data object from the list, and choose the + symbol next to the selection, as shown in
Figure 7‑5.
Figure 7‑5 Selecting a data object
The data object appears in Current Data Selection, as shown in
Figure 7‑6. Choose OK. You can modify your selection by choosing Delete, as shown in
Figure 7‑6, and selecting a new data object in Available Data.
Figure 7‑6 Current data selection displaying the data object
Crosstab Builder—Data displays the data from the selected data object, organized in dimensions and measures, as shown in
Figure 7‑7.
Figure 7‑7 Displaying dimensions and measures in the data object
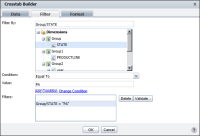
5 To display a subset of the available data in the cross tab, you can specify a filter condition for the data object, as shown in
Figure 7‑8.
Figure 7‑8 Specifying a data object filter
To create a filter at the data object level, choose Filter and specify one or more filter conditions, as you would do for a BIRT report. For example, to view data only for Pennsylvania (PA) create a filter on the state dimension, using the Equal To operator, as shown in
Figure 7‑8.
The cross tab displays aggregate extended price data by product line, for only the state of Pennsylvania, as shown in
Figure 7‑9.
Figure 7‑9 A cross tab displaying filtered data rows
You can also select the In operator in Condition to set a filter condition for more than one value. For example, you can define a filter condition that displays data for Pennsylvania (PA), California (CA), and Massachusetts (MA) in the cross tab.