How to display aggregate values in a cross tab
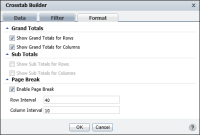
1 To specify display properties for the aggregate values in the cross tab, in Crosstab Builder, choose Crosstab Builder—Format, as shown in
Figure 7‑11.
Figure 7‑11 Specifying display options for the aggregate values
2 In Grand Totals, do the following:

Select Show Grand Totals for Rows to display grand totals for each row.
Select Show Grand Totals for Columns to display grand totals for each column.
3 You can display subtotals for multilevel dimensions used in rows or columns. Because the example in
Figure 7‑10 does not contain multilevel dimensions, the Sub Totals section is not highlighted. In Sub Totals, if highlighted, do the following:
Select Show Sub Totals for Rows.
Select Show Sub Totals for Columns.
4 In Page Break, as shown in
Figure 7‑11, select Enable Page Break to specify pagination properties for the cross tab, and do the following:
In Row Interval, type a value, such as 40.
In Column Interval, type a value, such as 10.
Choose OK. Sample data appears in the cross tab, displaying grand totals for rows and columns, as shown in
Figure 7‑12.
Figure 7‑12 Displaying grand totals for rows and columns in a cross tab