Organizing data in sections
A section is functionally equivalent to a group. When you create a section, you are also grouping data. Like groups, you can create multiple sections, calculate aggregate data for each section, start each section on a new page, and hide the details of each section.
One of the obvious differences between a section and a group is how the information is arranged. Compare the report designs in
Figure 4‑13 and
Figure 4‑14. The report in
Figure 4‑13 organizes data in two groups: sales office and product line. The report in
Figure 4‑14 organizes the same data in two sections: sales office and product line.
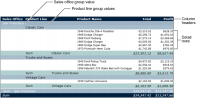
Figure 4‑13 Using groups to organize data
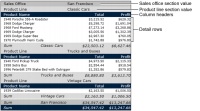
Figure 4‑14 Using sections to organize data
In
Figure 4‑13, the report design with groups displays the data from five fields in five columns. The sales office and product line values appear in the initial columns, below the column headers.
In
Figure 4‑14, the report design with sections, the sales office and product line values appear above the column headers.
As you can see when you compare the examples, organizing data in sections reduces the overall width of the table. If your report design displays many columns, and space is tight, this difference can be reason enough to create sections instead of groups.
Aside from the differences in the way information is arranged, organizing data in sections provides the following benefits over organizing data in groups:

You can insert multiple charts, one in each section, to reflect the aggregated data in each section. In a table that contains data groups, you can display only one chart, which presents the aggregated data for the overall table.
You can display additional data fields in a section heading. By default, a section heading displays only a label and the section value, as shown in the report design in
Figure 4‑14.
You can use both groups and sections in a single report design.
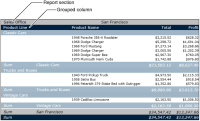
Figure 4‑15 shows a report design that contains the same data as the previous examples, except the sales office column is a section, and the product line column is a group.
Figure 4‑15 Using a group and a section to organize data