Aggregating data
One of the key features of any report is the ability to display summary, or aggregate, data. Many of the report examples shown in this document contain aggregate data. The product profitability report design, for example, shows sales and profit subtotals for each product line by sales office, a sales and profit total for each sales office, and grand totals for the company.
Aggregating data involves performing a calculation on a set of values. For a simple listing report that does not organize data in groups or sections, aggregate calculations are performed on values in a selected column, over all the data rows in a table. The listing report design in
Figure 4‑22 displays aggregate data for the Total and the Profit columns at the end, or footer, of the table.
Figure 4‑22 Displaying aggregate data in a simple listing report
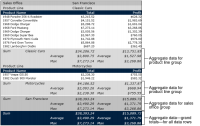
For a report design that organizes data in groups or sections, as shown in
Figure 4‑23, you can display aggregate information for a selected column or columns, for each group of data rows, and for all the data rows in the table. In this report design, the aggregate data appears in the footer of each group and in the footer of the table.
When you aggregate data in a selected column, you specify the following information:

The type of aggregate calculation. For both the Total and Profit columns, the report design in
Figure 4‑23 displays the sum of the values, the highest (max) value, and the average value. For each column, you can display a maximum of three aggregations. Each aggregation appears on a separate row.
Whether to perform the aggregate calculation across all the data rows in the table, or across the data rows in each group, or both. Aggregating data for groups applies only to report designs that organize data in groups or sections.
Whether to display the aggregate data in the footer or header of the table or the groups. The previous examples show aggregate data in the footers, which is typical. Select header to display the aggregate data at the beginning of the table or group.
The aggregate calculations you can perform on a column depend on the column’s data type. You can perform aggregate functions that involve a mathematical calculation, such as Sum and Average, only on numeric data.
The most common aggregate functions you perform on string data are Count and Count Value. Count returns the number of values in a column, including duplicate values. Count Value returns the number of distinct values in the column. You can use Count Value on a customer name column to get the number of customers.
Figure 4‑23 Displaying aggregate data for groups and sections
For date‑and‑time data columns, you can use the Min and Max functions to get the earliest and the latest date, respectively, from a column displaying order dates. For descriptions of the supported aggregate functions, see
Functions and operators.