How to create a summary table
The process to create a summary table using a data set in a template, an information object, or a data object data source is the same. This section describes how to create a summary table using any of these data sources.
1 Launch BIRT Studio, select a template, then select a data source.
2 Table Builder appears. In Table Builder, complete the following steps:
1 In Table Builder—Data, in Fields, select Summarize to create a summary table. Current Measure Selections is highlighted.
2 In Fields, in Available Data:
1 Press Ctrl and select each dimension and attribute data field to insert in the report design. Then choose the right arrow.
2 Press Ctrl and select the measure fields to insert in the report design. Then choose the right arrow.
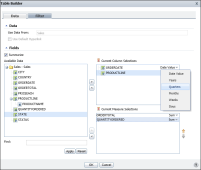
The selected data fields, Order Date and Product Name, appear in Current Column Selections, as shown in
Figure 6‑4. The selected measure fields, Order Total and Quantity Ordered, appear in Current Measure Selections. Use the arrows to modify the order in which you want the selected fields to appear in the report design.
3 If the data source contains a large number of data fields, type the name of the field in Find, then choose Apply. If the data field is found, Table Builder displays the data field in Available Data. Select the data field, then choose the right arrow. The data field appears in Current Column Selections. Repeat this step to retrieve each additional data field for which you can supply a name.
4 For each selected dimension field containing date‑and‑time data, you can group the data in intervals. Select an available interval from the Date Value drop-down list.
Figure 6‑4 shows the Order Date field grouped in quarters.
Figure 6‑4 Grouping date dimension column in quarterly intervals
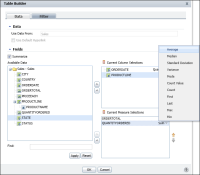
5 For every measure field containing numeric or string data, select an aggregate function to apply from the drop‑down list. For columns containing numeric data, the default aggregation function selected is Sum. To aggregate a measure field by an additional function, do the following:
1 Select the field once again in Available Data. Then choose the right arrow so that the measure field appears once again in Current Measure Selections.
2 Use the menu to choose a new aggregate function to apply to the field.
Figure 6‑5 shows the average function applied to the Quantity Ordered field.
Figure 6‑5 Aggregating measure columns
6 To limit the data displayed in the report, create a data set filter for dimension and attribute fields, in the same way you did for a detail report.
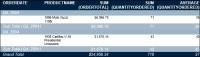
Choose OK. BIRT Studio displays the selected data fields in a summary table, as shown in
Figure 6‑6. You are now ready to modify the summary table.
Figure 6‑6 Summary table report design