About analytic dashboards
Analytic dashboards display data from one or more data object files in visualization gadgets and selection gadgets. Data visualization gadgets use charts, tables, cross tabs, and Flash gadgets to help users analyze and explore data.
Data selection gadgets help users to select data to display in data visualization gadgets. For example, a data selection gadget presents a list gadget displaying cities where customers live. A chart gadget links to this list. When a user selects one or more cities, the chart is updated to display only data for the selected cities.
Gadgets can link together to share information.
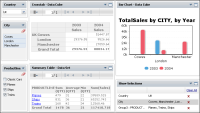
Figure 4‑1 shows an example of an analytic dashboard.
Figure 4‑1 Displaying an analytic dashboard
Multiple gadgets can link together to offer:

Cascading selections, such as country, state, and city

Different views of data from the same data source

Displays of related data from multiple data sources
BIRT report developers create data object files using BIRT Designer Professional. These files must reside in the Encyclopedia volume before analytic dashboards can use them as data sources.

