Selecting a data object to display
Analytic dashboards display data from BIRT data objects. Data visualization and data selection gadgets require a data object file. Each gadget displays data from one data set or data cube in the selected data object. After a data object is used in a dashboards, it appears as an available data object to all other gadgets, as shown in
Figure 4‑3.
Figure 4‑3 Choosing an available data object
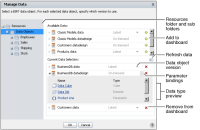
To select from additional data objects, choose New Data in Use Data From. Manage Data appears and enables developers to browse, select and refresh available data objects.
Figure 4‑4 shows an example of selecting available data objects.
Figure 4‑4 Viewing available BIRT data store and BIRT data design files
Using data sets and data cubes
A data set contains rows of data, organized in tables, that are not aggregated. Each table has columns of data and each column has a name. For example, a table of order data that has column names of order number, order date, order value, client name, sales person has one or more rows containing values for each column. When data is not aggregated, data is displayed for each row in the data set. When there are many rows of data, it can be difficult to analyze or group the data. For example, duplicates can appear from multiple orders on the same date or sold by the same salesperson.
Gadgets such as tables and charts can aggregate the data from a data set. BIRT developers can assign analysis types to data columns in a data set. Analysis types identify associated values and measures that a user can use when aggregating the data.
A data cube contains data that is already aggregated into dimensions, attributes, and measures of data and is optimized for data analysis. A data cube is a multidimensional data structure optimized for data analysis. For example, a data cube can contain the calculated sum and average of all product sales, grouped by location, date of sale and product type. Because this data is precalculated, it is faster to access than if the calculations were made on demand, especially for large amounts of data.
Previewing data objects
When previewing data sources to add to a gadget, you can browse the structure of data sets and data cubes. Manage Data also appears when you select Manage Data from the dashboard menu.
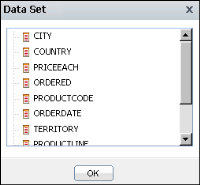
Figure 4‑5 shows an example of browsing a data set in a data object file.
Figure 4‑5 Browsing a data set
Data sets can contain one or more data fields that display as columns in gadgets.
When the BIRT report developer creates a data cube, they create measures and dimensions, from data columns. Measures are typically numerical values such as quantity sold, that are aggregated with a summary function such as sum, min, or max. Dimension are groups of similar values, typically organized in a hierarchy. These levels are used when users drill into the dimension group to view the current data with increased detail or in a summary.
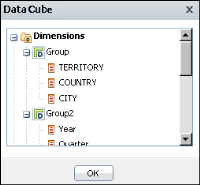
For example, a dimension group called location contains territory, country, state, and city values. A user viewing this data in a chart by country drills up from country to view the same data summarized by territory.
Figure 4‑6 shows an example of browsing a data cube inside a data object file.
Figure 4‑6 Browsing a data cube
Data cubes contain the following data categories that can display in gadgets:

Levels: data columns associated with dimension groups. For example, levels named territory, country, and city can be part of a dimension named location.

Dimensions: groups of levels, such as location or time periods. For example, a dimension named order date can contain dates in levels such as year, quarter, and month.

Measures: aggregate values, such as units sold or sale price.
BIRT report developers add these categories when they design the data object.
The selected data structure loads into a gadget for the user to assign to parts of the gadget. For example, after loading a customer data set to a table gadget, the different fields in the data set, such as customer name and email address, appear in the gadget’s data settings.
Refreshing a data object
Refresh a data object store when using the latest data version and the latest version contains a different data structure. For example, a report developer changes a data object design to include a new dimension for display on the dashboard. The dashboard developer has existing gadgets on the dashboard that use the data store and want to update them to include the new dimension. In Data Manager, the developer chooses Refresh. All gadgets using the latest version of the data store will refresh and enable the new dimension.
When refresh is not used, the existing gadgets use the latest version of the data but the new dimension is unavailable for use in the gadget.
Setting parameters for data objects
Dashboard developers use parameters to input values to a data object for filtering, formatting or processing data. When parameters exist in data objects, they appear on Manage Data as parameter bindings. Launch Manage Data by choosing Manage Data from the dashboard menu or adding a new data object to a dashboard.
Parameters can appear in the following ways:

One or more values that the user selects

One or more fields where the user types values

Cascading selections that present the user with choices based on other selections

One or more conditional operators and corresponding values that the user selects
Parameters in a data object affect data in all gadgets on the user’s dashboards. For example, specifying two cities in a data object’s parameter causes gadgets using that data object to only show data from the two selected cities. Each gadget can later apply additional filters.
BIRT report developers add parameters to data objects using BIRT Designer Professional and decide if the parameter value filters data or is used in a script in the data object.


