About operational dashboards
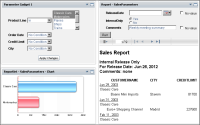
Operational dashboards display entire BIRT files, selected parts of BIRT files, and external content as gadgets on a web page. Each gadget displays its contents in a column or free form layout on the dashboard, as shown in
Figure 3‑1.
Figure 3‑1 Displaying an operational dashboard
Report gadgets display entire BIRT document and design files. Reportlet gadgets display only a single bookmarked component of BIRT document and design files. For example, a BIRT document that contains a table and chart can display the entire document in a report gadget, or only the chart in a Reportlet gadget.
Parameter gadgets display parameter settings contained in BIRT document and design files. Users specify parameter values in parameter gadgets to update a linked gadget with new data. For example, two report gadgets contain a parameter to select a country. Instead of displaying the parameter in both report gadgets, you can list the country names in a parameter gadget and link the report gadgets to the list. Changing the parameter gadget’s value updates the linked report gadgets on the dashboard.
Report and Reportlet gadgets require the BIRT for iHub option. These gadgets also support interactive viewing when the BIRT Interactive Viewer for iHub option is installed on the BIRT iHub.
Extras gadgets display external web content, such as images, web pages or web applications, and custom gadgets on the dashboard.

