Aggregating data
One of the useful features in a report is the ability to display summary, or aggregate, data. Many example reports in the previous sections of this document contain aggregate data. For example, a sales report can show the overall sales total; sales subtotals by product type, region, or sales representatives; average sales figures; or the highest and lowest sales figures.
Aggregating data involves performing a calculation on a set of values. For a simple listing report that does not organize data in groups, you can perform aggregate calculations on values in a selected column, across all the data rows in a table.
For example, consider a report that has a column calculating price*quantity. You can use the sum of the calculations in this column to obtain the total price of all items. You can create up to three aggregations for each report column.
When you aggregate data, you choose whether the aggregation appears in the table header or footer. If the column is grouped, you can display the aggregate value in the group header or footer. The report in
Figure 5‑13 displays aggregate data for the Total and the Profit columns at the end, or footer, of the table.
Figure 5‑13 Report displaying aggregate data
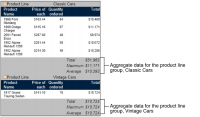
In a report that organizes data into groups, you can display aggregate data for a selected column or columns. You can also perform aggregations for each group of data rows, and for all the data rows in the table. In the example report shown in
Figure 5‑14, the aggregate data appears at the footer of each group.
Figure 5‑14 Aggregate data by product line group


