Displaying detail and summary data
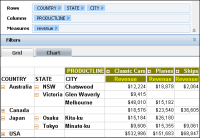
Typically, a cross tab displays data in a hierarchy. For example, a cross tab might display data by country, state, and city, or by year, quarter, month, and day. Data Analyzer supports drilling up to display higher-level, summary data, or drilling down to display lower-level, detail data. Hiding details, particularly for a cross tab that runs into hundreds of pages, helps you display key information at a glance. The following illustrations show two cross tabs that contain the same data. In
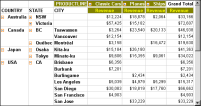
Figure 3‑38, the cross tab displays the revenue-detail data for cities.
Figure 3‑38 A cross tab displaying revenue-detail data for cities
In
Figure 3‑39, the cross tab hides the details, showing revenue-summary data for each country.
Figure 3‑39 A cross tab displaying revenue-summary data for countries
Data Analyzer limits the cross tab page size to approximately 33 MB. Displaying a larger cross tab can freeze the browser. The following message appears if you attempt to display an oversize cross tab page:
Oversize page content can freeze your browser. Open the options dialog to apply page break or open the drill dialog to apply the appropriate filter to reduce its size.
You can hide details to reduce the size of a cross tab. Alternatively, a BIRT iHub System administrator can change the value of the MAX_PAGE_SIZE parameter in web.xml to display a larger cross tab. For more information about modifying web.xml, see Information Console Developer Guide.
Data Analyzer provides the following ways to hide or show detail values:

In the structure pane, if more than one hierarchy level appears in Columns or Rows, you can hide the detail values for a level. For example,
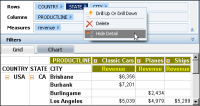
Figure 3‑40 displays country, state, and city levels in Columns. To hide details in the level below state, in the structure pane, right-click State, and choose Hide Detail, as shown in
Figure 3‑40.
Figure 3‑40 Choosing Hide Detail
In
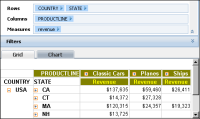
Figure 3‑41, the structure pane and cross tab show country and state levels and hide the city level.
Figure 3‑41 Viewing a cross tab with hidden detail

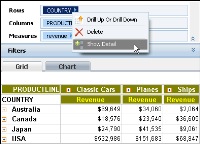
To show detail for a level, in the structure pane, right-click the level in Rows or Columns. Then, choose Show Detail. For example, right-click Country and choose Show Detail, as shown in
Figure 3‑42.
Figure 3‑42 Choosing Show Detail
The cross tab and the structure pane display detail levels, as shown in
Figure 3‑43. The cross tab expands the hierarchy levels under Country. This cross tab does not display the countries details for Canada and USA, which the user did not select to appear using the Drill Up Or Drill Down dialog box.
Figure 3‑43 Viewing a cross tab showing detail

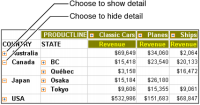
To show detail for a dimension, choose a plus sign (+). To hide detail, choose a minus sign (-), as shown in
Figure 3‑44.
Figure 3‑44 Choosing to show or hide detail

You can select from a list in which levels to show details and in which levels to hide details. The next section describes making multiple selections.
How to display detail and summary data
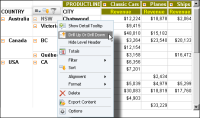
1 Right-click a column or row dimension that is in a hierarchy. From the menu, choose Drill Up Or Drill Down, as shown in
Figure 3‑45.
Figure 3‑45 Choosing Drill Up Or Drill Down for row headings
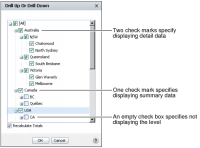
2 In Drill Up Or Drill Down, select items in the list to show detail data. For example,
Figure 3‑46 shows the levels in Australia selected to show detail data and the levels in Canada and USA deselected to show summary data. Two check marks in a check box specify displaying detail data for the level. One check mark specifies displaying summary data for the level. An empty check box specifies not displaying the level.
Figure 3‑46 Using Drill Up Or Drill Down
Choose OK.
Figure 3‑47 shows a cross tab that displays detail data for states and cities in Australia and summary data for Canada and USA.
Figure 3‑47 A cross tab displaying detail and summary data
How to specify the number of levels of detail data in the Drill Up Or Drill down dialog
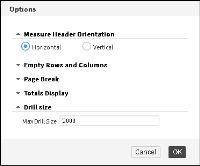
To display a more manageable number of level items in the user interface and prevent a potential web browser freeze, you can configure a limit for the number of level items that appear in the Drill Up Or Drill Down dialog box. The default value for the number of levels that can appear in the Drill Up Or Drill Down dialog box is 2000. To change the number of levels that appear in the Drill Up Or Drill Down dialog box, complete the following tasks:
1 Choose Edit➛Options.
2 In Options, expand Drill size, and provide a value for the maximum number of levels that can appear in the Drill Up Or Drill Down dialog, as shown in
Figure 3‑48.
Setting the MaxDrillSize option value equal to or less than zero (0) removes the restriction on the number of level items that appear in the Drill Up Or Drill Down dialog box.
Figure 3‑48 Setting MaxDrillsize option
