Writing event handlers that respond to user interactions
Depending on what you want to accomplish, you can create some of these interactivity event handlers without scripting. For typical event handlers, the script editor in the chart builder simplifies the process by providing a list of chart elements, a list of events, and a list of actions. Select the chart element you wish to make interactive, select an event, such as Mouse Click or Mouse Over, then select an action, such as Show Tooltip or Hyperlink. To implement a custom action, choose Invoke Script, then write JavaScript code. For HTML5 charts, this code can use the Highcharts API.
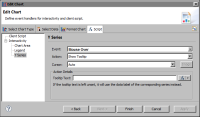
Figure 12‑7 shows an example of an event handler defined for a chart’s Y series. The event handler runs when the Mouse Over event is triggered. When triggered, the Show Tooltip action runs. In this example, the tooltip is set to display the series data, which is typical.
Figure 12‑7 Script editor displaying an interactivity event handler
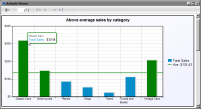
Figure 12‑8 shows the results of the previous event handler. When the user places the mouse pointer over the first bar in the bar chart, a tooltip displays the series data value.
Figure 12‑8 A tooltip displays a bar’s data value when the user places the mouse pointer over the bar
Figure 12‑9 shows an example of an event handler defined for a chart’s legend. The event handler runs when the Mouse Click event is triggered. When triggered, the Invoke Script action runs. In this example, the following script brings a series in an area chart to the front when the user clicks the series name in the legend:
evt.target.group.toFront();
This line of code calls a method in the Highcharts API.
Figure 12‑9 Script editor displaying an event handler that runs a script
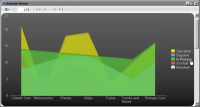
Figure 12‑10 shows the results of the previous event handler. When the user clicks the In Process series in the area chart’s legend, the corresponding series in the chart displays in front of the other overlapping series.
Figure 12‑10 In Process series displayed in front when the user clicks the series name in the legend
Compared to BIRT charts, HTML5 charts support fewer events and actions, and fewer chart elements on which to define event handlers. The additional events that BIRT charts support, but that HTML5 charts do not, include Mouse Down, Mouse Up, Mouse Move, Key Down, and Key Up. The additional chart elements for which you can define event handlers in a BIRT chart, but not an HTML5 chart, include the chart title,y-axis, and x‑axis.
If you begin by creating a BIRT chart, then later change the output format to HTML5, BIRT ignores the event handlers defined for events that are specific to a BIRT chart when generating the chart. This behavior provides the flexibility of creating and maintaining event handlers for either chart format with the option of changing the chart format at any time without any additional changes to the design.


