Scripting example 2
The bar chart in
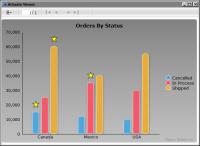
Figure 12‑13 shows custom objects, stars, that are added through scripting. Each star indicates the highest value for each order status series. A script in afterRendering( ) performs the following tasks:

Calculates the highest (max) value for each y‑series

Draws a star based on the width of the bar

Positions the stars at the top of the appropriate bars
This script showcases Highchart’s renderer object, which supports drawing shapes, such as circles, rectangles, and stars, and adding images and text to a chart. The renderer is useful for adding annotations to a chart. For example, instead of a star, you can annotate the max value by creating text and enclosing it in a rectangle.
Figure 12‑13 Bar chart with custom objects
The JavaScript code written for this bar chart appears in
Listing 12‑3.
Listing 12‑3 Event-handling script for the bar chart with custom objects
afterRendering: function(myChart)
{
// Get the chart object
chart=myChart.getCore();
// Get the max values from the y-axis series
for ( var i = 0; i < chart.series.length; i++ )
{
var mySeries = chart.series[i];
var maxValue = mySeries.data[0].y;
var maxValueIdx = 0;
if ( !maxValue )
{
maxValue = 0;
}
for ( var j = 1; j < mySeries.data.length; j++ )
{
var curValue = mySeries.data[j].y;
if ( !curValue )
{
continue;
}
if ( maxValue < mySeries.data[j].y )
{
maxValue = mySeries.data[j].y;
maxValueIdx = j;
}
}
var maxPoint = mySeries.data[maxValueIdx];
// Create a group to hold each annotation
var group = chart.renderer.g().add();
// Draw a star based on the width of the column,
// and add it to the group
var star = chart.renderer.path(['M', maxPoint.barW/2, 0,
'L',
maxPoint.barW*.4, maxPoint.barW/4,
maxPoint.barW*.05, maxPoint.barW/4,
maxPoint.barW*.325, maxPoint.barW*.475,
maxPoint.barW*.2, maxPoint.barW*.85,
maxPoint.barW/2, maxPoint.barW*.6,
maxPoint.barW*.8, maxPoint.barW*.85,
maxPoint.barW*.675, maxPoint.barW*.475,
maxPoint.barW*.95, maxPoint.barW/4,
maxPoint.barW*.6, maxPoint.barW/4,
'Z'])
.attr({
fill : 'yellow',
stroke: 'black',
'stroke-width': 1
}).add(group);
// Move the group to the top of the correct bar, and set it to
// draw in front of everything in the chart
group.attr({
translateX: maxPoint.barX + chart.plotLeft,
translateY: maxPoint.barY + chart.plotTop - maxPoint.barW - 10
});
group.toFront();
}
},
