Scripting example 3
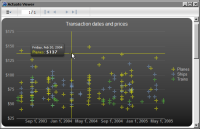
The scatter chart in
Figure 12‑14 shows a vertical and horizontal plot line and tooltip that appear when the mouse pointer is placed over a data point. The plot line and tooltip disappear when the mouse pointer is moved away from a data point.
Figure 12‑14 Scatter chart displaying a dynamic plot line and tooltip
The event-handling script to display and remove the plot line dynamically appears in
Listing 12‑4.
Listing 12‑4 Event-handling script to display a plot line dynamically
beforeRendering: function(options, chart)
{
options.plotOptions = {
series : {
point : {
events : {
mouseOver: function() {
this.series.xAxis.addPlotLine({
color: this.series.color,
width: 1,
value: this.x,
id: 'dynamicVerticalPlotLine'
});
this.series.yAxis.addPlotLine({
color: this.series.color,
width: 1,
value: this.y,
id: 'dynamicHorizontalPlotLine'
});
},
mouseOut: function() {
this.series.xAxis.removePlotLine('dynamicVerticalPlotLine');
this.series.yAxis.removePlotLine('dynamicHorizontalPlotLine');
}
}
}
}
};
},

