Using built‑in Flash charts and gadgets : Using animation and other visual effects : Bevel effect
 
Bevel effect
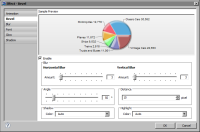
Use the bevel effect to create bevels on chart and gadget objects. This effect is typically applied to a data plot, as shown in Figure 14‑30. As the figure shows, the bevel makes the pie chart appear more three-dimensional. By setting properties, you can control the angle, depth, and color of the bevel.
Figure 14‑30 Definition of a bevel effect
Table 14‑20 describes the bevel properties.
Table 14‑20 Bevel properties 
Property
Description
Angle
Specifies the angle of the bevel. Values are 0 to 360 degrees.
Distance
Specifies the offset distance of the bevel. Values are in pixels.
Highlight
Specifies the color of the highlight portion of the bevel.
Horizontal Blur
Specifies the amount of horizontal blur in pixels.
Shadow
Specifies the color of the shadow portion of the bevel.
Vertical Blur
Specifies the amount of vertical blur in pixels.