Task 5: Select data for the Flash chart
In this procedure, select the data to present in the chart.
1 In the Flash chart builder, choose Next to display the Select Data page.
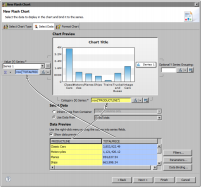
On this page, under Select Data, Use Data From is selected by default and its value is set to SalesTotals, the data set you created earlier. Data Preview shows the columns and values returned by the data set.
2 In Data Preview, select the PRODUCTLINE column header and drag it to the empty field to the right of Category (X) Series, as shown in
Figure 14‑36.
3 Select the TOTALPRICE column header and drag it to the empty field in Value (Y) Series, as shown in
Figure 14‑36.
Figure 14‑36 Specifying the data to use for the category and value series
The image in Chart Preview changes to use the specified data.
4 Before formatting the Flash chart, preview the chart.
1 Choose Finish to close the Flash chart builder.
2 In the layout editor, enlarge the Flash chart. Increase its width to seven inches, and increase its height to three inches.
3 Run➛View Report➛In Web Viewer.
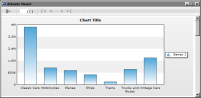
The Flash chart is animated. Columns are drawn linearly from the bottom to the top.
Figure 14‑37 shows the generated chart.
Figure 14‑37 Preview of the Flash chart
5 Close the viewer.