Task 8: Change the animation effect of the columns
As you saw earlier, the default animation for a column chart is the drawing of columns vertically from bottom to top. In this procedure, animate the columns to grow in both height and width.
1 In Effects, in Chart Parts, select Data Plot.
2 Choose Add to create a new effect.
3 In Add New Effect, type the following text as the name of the effect, then choose OK:
Animate Columns
4 Specify the following animation values:

Select Enable.
In Attribute to Animate, select Horizontal Scale
In Start Value, select Canvas Start X.
In Duration, type 3.
In Type, select Linear.
5 Choose OK to save the effect.
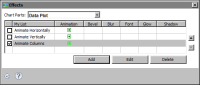
In Effects, the Animate Columns effect is added to the list, as shown in
Figure 14‑41.
Figure 14‑41 Effects listing the three effects created
6 Close Effects, then choose Finish to close the Flash chart builder.
7 View the report in the web viewer.