Task 3: Divide the data area into regions
In this procedure, divide the data area into three regions labeled Fair, Good, and Excellent.
1 In the layout editor, double-click the gauge to open the Flash gadget builder.
2 Choose Format Gadget.
3 Choose Regions from the list of options.
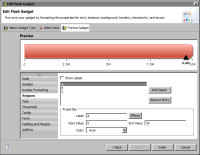
Figure 14‑44 shows the default region properties. There are three predefined regions: A, B, and C. A is selected by default.
Figure 14‑44 Format Gadget page displaying default region properties
4 In Properties, change the properties of region A as follows:
1 In Label, type:
Fair
2 In Start Value, use the default value 0.
3 In End Value, type 3,000,000.
4 In Color, select a red color.
5 Select B, then set its properties as follows:
1 In Label, type:
Good
2 In Start Value, type 3,000,000.
3 In End Value, type 7,500,000.
4 In Color, select a yellow color.
6 Select C, then set its properties as follows:
1 In Label, type:
Excellent
2 In Start Value, type 7,500,000.
3 In End Value, type 10,000,000.
4 In Color, select a green color.
Preview shows the data area of the gauge divided into three regions, as shown in
Figure 14‑45. The regions appear in the specified colors, but the region labels do not appear.
Figure 14‑45 Gauge displaying three regions
7 Select Show Labels to display the region labels. The gauge displays Fair, Good, and Excellent in the corresponding regions, as shown in
Figure 14‑46.
Figure 14‑46 Gauge displaying region labels

