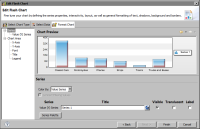
The Flash chart builder is similar to the standard BIRT chart builder. Both provide a separate page for formatting tasks.
Figure 14‑2 shows an example of the Format Chart page displaying Series properties for a Flash chart. This page is similar to the Format Chart page in the standard chart builder. The primary difference is the capability to add animation and special visual effects, such as bevels, glow, and blur, to a Flash chart. These tasks are described later in this chapter.
