How to create an effect
1 Select the part of the chart or gadget to which to apply an effect. If the selected part supports effects, the Effects button appears.
2 Choose Effects. Effects shows the part of the chart or gadget selected for an effect.
Figure 14‑25 shows an example of X-Axis Labels selected for a Flash chart.
Figure 14‑25 Effects displaying the chart part selected for an effect
3 To apply an effect to a different part of the chart or gadget, select a different part from the drop-down list.
4 Choose Add to create an effect.
5 In Add New Effect, type a name for the effect, then choose OK. Effect, shown in
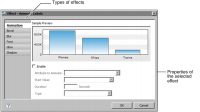
Figure 14‑26, lists the types of effects that you can apply. Animation is selected by default.
Figure 14‑26 Types of effects that can be set for Flash object
6 Choose an effect type, then choose Enable.
7 Set the properties of the selected effect type. The properties of each effect type are described later in this chapter.
8 If desired, choose another effect type. For example, you can create an effect that uses the glow and shadow effect types.
9 Choose OK when you finish creating the effect. Effects displays information about the effect you created.
Figure 14‑27 shows an example.
Figure 14‑27 A defined effect named Animate Labels
My List shows an effect named Animate Labels. The check mark indicates that the effect applies to X-Axis Labels. The symbol under Animation and Font indicates that the Animate Labels effect uses animation and font effects.
For specific examples of creating effects, see the tutorials later in this chapter.


