Task 10: Create the dataURL variable
In this procedure, create the dataURL variable to pass the XML data generated by the plug‑in to the Flash chart.
1 Open the report design perspective by choosing Report Design in the toolbar.
2 Choose RevenueByCountry.rptdesign, the report you created earlier in this tutorial.
3 In the report layout, select the Flash object.
4 In Property Editor, choose the Flash Variables tab.
5 In Flash Variables, choose Add.
6 In Add Variables, do the following:
1 In Name, type:
dataURL
2 In Expression, choose the JavaScript expression builder.
7 In the JavaScript expression builder, type the following expression:
flashContext.createDataURL("CombChartXMLFormat", true, null);
The first argument, CombChartXMLFormat, is the format specified in the extension properties of the plug‑in. The second argument, true, specifies that the URL is encoded. The third argument, null, specifies that there are no custom parameter names and values to pass to the URL.
8 Choose OK.
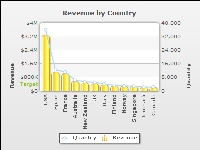
9 Preview the report. The Flash chart should look like the one shown in
Figure 15‑34. The chart has two
y axes. The left axis displays revenue values and the right axis displays quantity values. The column chart presents revenue data and the line chart presents quantity data.
Figure 15‑34 Preview of Flash chart

