Task 4: Add a Flash chart to the report
In this procedure, add the 2D dual-Y combination chart from the Flash object library to the report.
1 Drag a Flash Object element from the palette and drop it in the report layout.
2 In Flash Builder, specify the following information:
1 In Select content from, select Flash Object Library.
2 In Enter resource file, choose the open folder button to select a Flash file from the library.
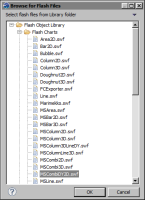
3 In Browse for Flash Files, expand Flash Charts, and select MSCombiDY2D.swf, as shown in
Figure 15‑22.
Figure 15‑22 Selecting a Flash chart from the Flash Object Library
4 Choose OK. In Flash Builder, the path to the Flash file appears in Enter resource file.
3 Choose Finish.
4 Bind the Flash object to the Revenue data set.
1 While the Flash object is selected, in Property Editor, choose the Binding tab.
2 In the Binding page, in Data Set, select Revenue.
The Flash object has access to data in the selected data set.

