Task 7: Format the report
Now that you verified that the report displays the correct data in the correct order, you can turn your attention to improving the report’s appearance. You perform the following tasks in this section:

Edit the text of the column headings.
Format the column headings.
Display the contact first and last names on the same line.
Increase the space between rows.
Edit the column headings
1 Choose Layout to return to the layout editor.
2 Double-click the first column heading, CUSTOMERNAME. The column heading is in the first row—the header row—of the table.
3 To replace all the highlighted text, start typing, then press Enter when you finish. To edit the text, click once to deselect the text, then position the cursor where you want to add or delete characters.
Replace CUSTOMERNAME with the following text:
Customer
4 Repeat steps
2 and
3 to change the second and third column headings to the following text:
Phone
Contact
The report design should look like the one shown in
Figure 2‑26.
Figure 2‑26 Revised column headings in a report design
Format the column headings
To format a report element, set its properties in one of the following two ways:
Set an element’s properties through Property Editor. Use this method to format only the selected element.
Define a style that contains the desired properties, and apply the style to an element. Use this method to define format properties once and apply them to more than one element.
You might notice that in the report design, the column headings appear in plain text and are left-aligned. The generated HTML report, however, displays the column headings in bold and centered. This discrepancy occurs because BIRT uses the browser’s default format for items placed in a table header.
In this procedure, you use the Property Editor to align the column headings to the left, and you define a style to add color to the header row.
1 To format the column headings using Property Editor:
1 Select all the column headings. To select multiple elements, press and hold the Shift key as you click each element. Property Editor displays the properties for the selected elements, as shown in
Figure 2‑27.
Figure 2‑27 Properties for selected elements in Property Editor
2 Choose the Left button to align the column headings to the left.
3 Choose the B button to format the column headings as bold text.
4 Deselect the column headings by clicking the white space outside the table.
2 To add a background color to the header row, using a style:
1 From the main menu bar, choose Element➛Style➛New Style.
New Style appears, as shown in
Figure 2‑28. The left side displays the property categories. The right side displays the properties for the category that you select.
Figure 2‑28 New Style
2 For Custom Style, type the following name for the style:
table_header_row
3 Choose Background from the list of property categories. New Style displays the background properties that you can set.
4 Specify a color for the Background Color property, using one of the following methods:
Select the button next to the property, then select a color from the color palette that appears.
Select a color from the drop-down list.
Choose OK.
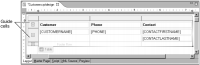
5 In the layout editor, select the table. Selecting the table causes guide cells to appear at the top and left side of the table, as shown in
Figure 2‑29.
Figure 2‑29 Guide cells at the top and left of a table
6 Select the guide cell next to the header row.
7 In Property Editor, choose Properties, then choose General to display the general properties for the row.
8 Apply the style that you just created by selecting table_header_row from the drop-down list next to Style. BIRT Report Designer applies the style to the header row and it appears in color.
3 Preview the report. The report should look like the one shown in
Figure 2‑30.
Figure 2‑30 Report preview showing header row style
Display first and last names on the same line
When you place multiple elements in a single cell, BIRT Report Designer creates block-level elements. If you are familiar with HTML, you know that each block element starts on a new line. To display multiple elements on the same line, you need to set them as inline elements. Alternatively, you can concatenate the first and last name values to display in a single data element, as described in this procedure.
1 Choose Layout to return to the layout editor.
2 Delete the data element that displays [CONTACTLASTNAME].
3 Double-click the data element that displays [CONTACTFIRSTNAME].
Edit Data Binding, shown in
Figure 2‑31, shows information about the data associated with the current data element. In Expression, dataSetRow["CONTACTFIRSTNAME"] indicates that the data element displays data from the CONTACTFIRSTNAME field in the data set.
Figure 2‑31 Edit Data Binding
4 Click the expression builder button next to the Expression field.
The expression builder displays the expression in the text area at the top of the window.
5 To concatenate the first and last names, edit the expression as follows:
dataSetRow["CONTACTFIRSTNAME"] + " " + dataSetRow["CONTACTLASTNAME"]
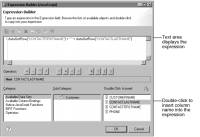
Figure 2‑32 shows this expression in the expression builder. The empty quotation marks (" ") add a space between the first name and last name. You can type the expression in the text area or double-click an item in the lower right of the window to insert it in the expression.
Figure 2‑32 The expression builder displaying the expression to concatenate data
6 Choose OK to close the expression builder.
The edited expression appears in Edit Data Binding.
7 Choose OK to save the changes to the data element.
8 Preview the report. The report should look like the one shown in
Figure 2‑33.
Figure 2‑33 Report preview showing concatenated contact names
Increase the space between rows
The default layout adds a minimum space between table rows. Typically, you will want to adjust the spacing between rows.
1 Choose Layout to return to the layout editor.
2 Select the table’s detail row, the middle row, as shown in
Figure 2‑34.
Figure 2‑34 Selected table row in the layout editor
Property Editor displays the properties for the row. The title that appears in Property Editor shows the type of element that you select, so you should see Property Editor—Row.
3 In the General properties, set Height to 24 points. The height of the row increases, as shown in
Figure 2‑35.
Figure 2‑35 Row height set to 24 points
4 Preview the report. The report should look like the one shown in
Figure 2‑36. There is more space between the rows of data.
Figure 2‑36 Report preview showing increased row spacing