Formatting an area chart
The style or color of the area borders can be changed or the borders themselves can be hidden. For example,
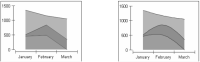
Figure 17‑2 shows a chart having standard lines bordering the areas on the left and curved lines bordering the areas on the right. Both charts in
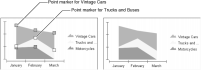
Figure 17‑3 have no lines bordering the areas.
Figure 17‑2 Area chart using different border line options
You can also add point markers that identify the data points that an area encloses. The legend uses the markers to identify the areas.
Figure 17‑3 shows one area chart that has markers and one that does not.
Figure 17‑3 Area charts with and without point markers
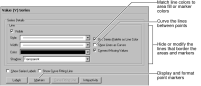
To format lines and markers on an area chart, navigate to the Value (Y) Series section of Format Chart, then modify labels, lines, or markers, as shown in
Figure 17‑4. Line formatting affects marker borders as well as area borders.
Figure 17‑4 Format options for an area chart