Laying Out and Formatting a Chart : Formatting specific types of charts : Formatting a Gantt chart
 
Formatting a Gantt chart
Gantt charts display project schedules using bars to show beginning and ending dates of multiple tasks. The colors of the bars represent the task status. Optionally, markers designate the start and end dates of tasks.
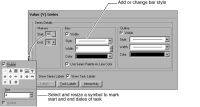
To add and format task markers and bars, navigate to the Value (Y) Series section of Format Chart. Use Value (Y) Series to change and resize the symbols that mark the start and end of a task. You can also specify the color, style, and size of symbol markers and task bars, as shown in Figure 17‑9.
Figure 17‑9 Formatting a Gantt chart