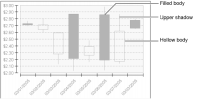
When you format a stock chart, change the color of the filled body of the candlestick using the Series Palette. You can also change the color and style of the shadows and hollow body, as shown in
Figure 17‑30.
To format a stock-chart series, navigate to the Value (Y) Series section of Format Chart, then format the candlesticks, display series labels, or add a curve-fitting line, as shown in
Figure 17‑31.