Formatting a three-dimensional chart
When you format a three-dimensional chart, use axis rotation to change the orientation of the chart or use unit spacing to set the space between series. You can also change the wall and floor colors and set the series depth.
Working with chart rotation
You can rotate the axes of a three-dimensional chart. To rotate axes, use the following settings:

The
x-axis rotation controls how the chart tilts toward or away from the viewer.
The
y-axis rotation controls how the chart pivots left and right on the
y‑axis in the center of the chart.
The
z-axis rotation controls how the chart tilts up and down on the central
z‑axis.
By default, a three-dimensional chart uses an
x-axis rotation of –20, a
y-axis rotation of 45, and a
z-axis rotation of zero. A chart that uses default rotation settings appears oriented like the one shown in
Figure 17‑32.
Figure 17‑32 Three-dimensional chart using default axis rotation
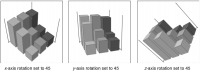
Figure 17‑33 shows the effects of changing each setting in the sample chart.
Figure 17‑33 Three-dimensional charts using different rotation settings
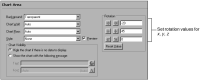
To change the rotation of an axis, navigate to the Chart Area section of Format Chart, then provide a rotation value, as shown in
Figure 17‑34.
Figure 17‑34 Setting rotation options
Working with the space between elements
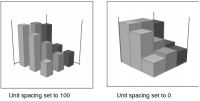
To control the space between adjacent series in a three-dimensional chart, you use unit spacing. The unit-spacing value is the percentage of the series width that appears between each series. For example, the default unit spacing is 50. Consequently, the space between two series elements in the chart, such as two sets of bars, is approximately 50 percent of the width of one series element.
Figure 17‑35 presents the difference between two unit-spacing settings in a sample three-dimensional bar chart.
Figure 17‑35 Charts using different unit-spacing settings
To change the spacing between adjacent series, navigate to the Chart Area section of Format Chart, then choose General Properties. In Unit Spacing, provide a value. The value specifies the percentage of the series width to use to separate series elements.
Setting the wall and floor colors
In a chart that has depth or a three-dimensional chart, you can modify the color of the chart wall and floor. The default wall and floor color setting is transparent.
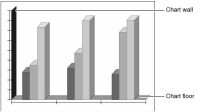
Figure 17‑36 shows where the wall and floor appear in a two‑dimensional bar chart with depth.
Figure 17‑36 Wall and floor of a chart using depth
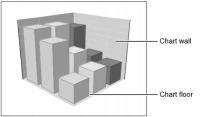
Figure 17‑37 shows the locations of the wall and floor in a three-dimensional chart.
Figure 17‑37 Walls and floor of a three-dimensional chart
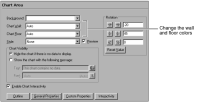
To set the wall or floor color of a chart using depth or a three-dimensional chart, navigate to the Chart Area section of Format Chart. Use the settings shown in
Figure 17‑38 to set a wall or floor color.
Figure 17‑38 Wall and floor color options