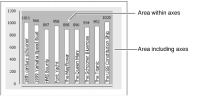
When you adjust the plot area, you can modify the entire plot area, which includes the axes, or only the area that appears within the axes.
Figure 17‑58 shows the two sections of the plot in a sample bar chart. The lighter area shows the area including axes. The smaller, darker area shows the area within the axes. To use one color across the entire plot, select that color in both areas.