Formatting the title area
When you apply a background color or outline to a chart title, you can work with the entire title area or with only the text area.
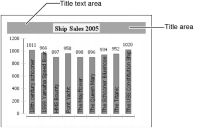
Figure 17‑66 shows the difference between the two areas in a sample chart.
Figure 17‑66 Title areas
If you apply a background color to the title area, the same color appears in the text area. Optionally, you can set a new background color or add a shadow to the text area. You cannot shadow the entire title area. To modify where the title appears within the chart, use anchor settings. To determine how much padding appears between the title or title text areas and other chart features, use inset settings.
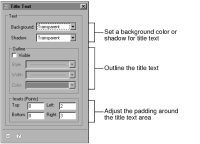
To add a background color, outline, or shadow to the chart title text area, navigate to Title in the Chart Area section of Format Chart, then choose Text to see the options that are shown in
Figure 17‑67. Use the settings to modify the title text.
Figure 17‑67 Formatting options for the text of the title
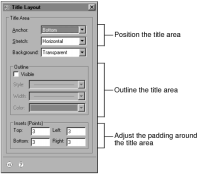
To add a background color or outline to the title area of the chart, or to position the title area, navigate to Title in the Chart Area section of Format Chart, then choose Layout to see the options shown in
Figure 17‑68.
Figure 17‑68 Formatting options for the title area