Working with axis markers
Axis markers highlight numbers or ranges on two-dimensional charts or charts with depth. You can use the following types of markers:

A marker line is a line that extends across the plot from a point on the axis. You specify the axis and value from which to draw the line.
A marker range is a rectangular area that highlights a range of values. You specify between which values and from which axis to draw the rectangle.
For example,
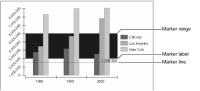
Figure 17‑78 shows a marker line and a marker range.
Figure 17‑78 Chart using a marker line and a marker range
Both markers highlight points on the y-axis. The marker line uses a label to show the marker value. You can change the style or color of the marker, change label text, or hide labels. Add a marker to an x-axis only if it shows numeric or date-and-time data. Adding a marker to an axis that shows text values as categories generally does not help users read the chart.