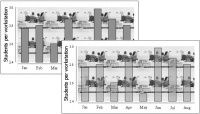
You can make a chart series translucent so you can see an image or color behind the chart data. For example,
Figure 17‑98 shows two versions of a chart that uses an image as the plot background. The chart on the left uses a solid series. The chart on the right uses a translucent series.