Task 4: Set up data for the cross tab
In this procedure, you set up the following items:

A data group, or dimension, containing values to use as the cross tab’s row headings
A data group, or dimension, containing values to use as the cross tab’s column headings
A summary field, or measure, providing aggregate values to use in the cells of the cross tab
Data that you set up for a cross tab is stored in an entity called a cube.
1 In Data Explorer, right-click Data Cubes, and choose New Data Cube.
2 In Cross Tab Cube Builder, specify the following information:
In Name, type
Sales Cube
In Primary dataset, select Sales.
3 Choose Groups and Summaries.
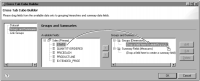
4 In Available Fields, expand Sales. Drag STATE and drop it on the following location, as shown in
Figure 18‑4:
(Drop a field here to create a group)
Figure 18‑4 Adding a state group to the cube
5 In Add Group, use the default group name. Choose OK.
6 Drag PRODUCTLINE from Available Fields and drop it on the following location:
(Drop a field here to create a group)
7 Use the default group name.
Cross Tab Cube Builder shows the STATE and PRODUCTLINE dimensions you created, as shown in
Figure 18‑5.
Figure 18‑5 Cross Tab Cube Builder displaying two groups
8 Drag EXTENDED_PRICE from Available Fields and drop it on the following location:
(Drop a field here to create a summary field)
EXTENDED_PRICE(SUM) appears under Summary Field. SUM indicates that the SUM aggregate function is used to calculate the totals of the EXTENDED_PRICE values. The cube builder selects the SUM function by default. You can, however, select a different function to apply to a measure by selecting the measure, then choosing Edit.
Figure 18‑6 shows the dimensions and measure you defined.
Figure 18‑6 Cross Tab Cube Builder displaying two groups and a summary field
9 Choose OK to save the cube. The Sales cube appears under Data Cubes in Data Explorer.
10 Expand the Sales Cube to view its contents, as shown in
Figure 18‑7.
Figure 18‑7 Data Explorer showing the Sales cube