Task 5: Add a cross tab to the report
In this procedure, you add a cross tab to the report, then you insert data from the cube into the cross tab.
1 Choose the palette, then drag a cross-tab element from the palette to the report. A cross tab appears in the report.
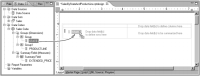
2 Choose Data Explorer. Under the first group in the Sales cube, drag STATE and drop it in the cross-tab area that displays the following text:
Drop data field(s) to define rows here
Figure 18‑8 Inserting STATE data in the cross tab
3 From the Sales cube, under Group1, drag PRODUCTLINE and drop it in the cross-tab area that displays the following text:
Drop data field(s) to define columns here
4 From the Sales cube, under Summary Field, drag EXTENDED_PRICE and drop it in the cross-tab area that displays the following text:
Drop data field(s) to be summarized here
The cross tab should look like the one shown in
Figure 18‑9.
Figure 18‑9 Cross tab design
5 Choose Preview.
Figure 18‑10 shows a portion of the data that the cross tab displays.
Figure 18‑10 Preview of the cross tab data
The row headings display the states, the column headings display product lines, and the cells display the sales totals. The first cell displays 458563.64, which is the sales total of classic cars sold in California.