How to create a multi-dataset cube
1 In Data Explorer, right-click Data Cubes, then choose New Data Cube.
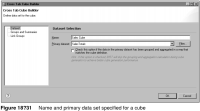
2 In the Dataset page of Cross Tab Cube Builder, supply the following information, as shown in Figure 18‑31:
1 In Name, specify a descriptive name, such as Sales Cube, for the cube.
2 In Primary dataset, select SalesTotals. In a multi-dataset cube, the fact data set that retrieves the data to calculate measures is the primary data set.
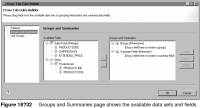
3 Choose Groups and Summaries to define the dimensions and measures for the cube. The Groups and Summaries page, shown in Figure 18‑32, displays the available data sets and fields.
4 Define the product line dimension, using the following steps:
1 Under the Productlines data set, drag PRODUCTLINE and drop it under Groups (Dimensions) in the drop location that displays the following text:
(Drop a field here to create a group)
2 In Add Group, use the default group name.
3 Under the Productlines data set, drag PRODUCTCODE and drop it on the PRODUCTLINE dimension. This action creates a hierarchical relationship between PRODUCTLINE and PRODUCTCODE.
5 Define the year dimension of the cube.
1 Under the SalesTotals (Primary) data set, drag SHIPPEDDATE and drop it under Groups (Dimensions) in the drop location that displays the following text:
(Drop a field here to create a group)
Group Level displays the different ways to group the dates. To display the dates as they appear in the data source, select Regular Group. To group the dates by any of the time periods, select Date Group.
2 Select Date Group, then select year, as shown in
Figure 18‑33.
Figure 18‑33 Group Level showing the year group selected
3 Choose OK to save the year dimension.
6 Define the cube’s measure. Under the SalesTotals (Primary) data set, drag EXTENDED_PRICE and drop it under Summary Fields (Measures) in the drop location that displays the following text:
(Drop a field here to create a summary field)
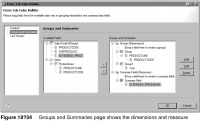
The Groups and Summaries page, shown in Figure 18‑34, displays the defined dimensions and measure.
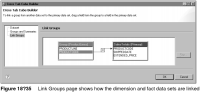
7 Link the data in the dimensions with the fact data set.
1 Choose Link Groups. The Link Groups page displays the Productline dimension you created and the primary (fact) data set.
2 Link the PRODUCTCODE field in both items, as shown in Figure 18‑35.
8 Choose OK to save the cube. You can now build a cross tab that uses data from this cube.
Figure 18‑36 shows a cross tab that uses the year and PRODUCTLINE dimensions and the EXTENDED_PRICE measure from the cube.
Figure 18‑36 Cross tab design
Figure 18‑37 shows the generated cross tab.
Figure 18‑37 Cross tab output