Displaying data values in one row
For typical listing reports, data is best presented in rows and columns in a table, as shown in numerous examples. If, however, a table displays data from one field only and the field contains a few values, you can improve the presentation by displaying all the values in one row. Compare the following layouts for displaying the locations of sales offices.
Layout 1:
Sales Offices:
London
New York
Paris
Layout 2:
Sales Offices: London, New York, Paris
The first layout uses a table conventionally.
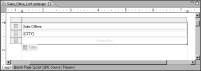
Figure 8‑45 shows the report design. The table’s header row contains a label to display the column heading, Sales Offices. The detail row contains the CITY field, which displays each city value in a separate row.
Figure 8‑45 Table layout to display cities, each in a separate row
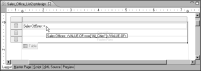
The second layout also uses a table. In this design, shown in
Figure 8‑46, the table’s header row contains a text element. This text element displays the static text, Sales Offices:, and refers to a column binding that returns the list of cities. The column binding uses the CONCATENATE function to join all the city values into a single string value.
Figure 8‑46 Table layout to display cities in one row