How to display aggregate data
1 In the palette, under Quick Tools, drag an aggregation element and drop it in the header or footer row of a group or a table.
2 In Aggregation Builder, specify the following information:
1 In Column Binding Name, type a unique name. Remember, for each piece of calculated data to display in a report, there must be a column binding. The column binding name appears in the report design if you do not specify a value for the next option, Display Name.
2 In Display Name, optionally type a name used only for display in the report design.
3 In Data Type, select the type of the aggregate value.
4 In Function, select an aggregate function.
5 In Expression, do one of the following:

Select a data set field whose values to perform the aggregate calculation.

If performing an aggregate calculation on values other than values in a data set field, type an expression. You can open the expression builder to get help constructing an expression.
6 In Filter Condition, specify the filter condition to use to determine which rows are factored in the aggregate calculation.
7 In Aggregate On, select either table or a specific group:

Select table to perform the aggregate calculation over all the rows in the table.

Select a specific group to perform the aggregate calculation over all the rows in the selected group.
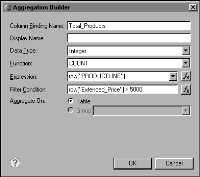
Figure 10‑12 shows an example of a complete definition for an aggregation element. In the example, the element returns the number of rows in the table, where the extended price of the product is greater than $5,000.00.
Figure 10‑12 Aggregation Builder displaying values for getting the count of products in the table
8 Choose OK.
In the report design, the aggregation element displays the sigma symbol followed by the column binding name, as shown in the following example:

[Total_Products]
3 Preview the report to verify the results of the aggregation.
